I found an interesting table in the May 2014 issue of MM&M that presents promotional spending data for the top 20 — based on total spend — US pharma companies. The source of these data is a Cegedim Strategic Data (CSD) “Audit.”
In this post I summarize some of the data in charts that you may find interesting.
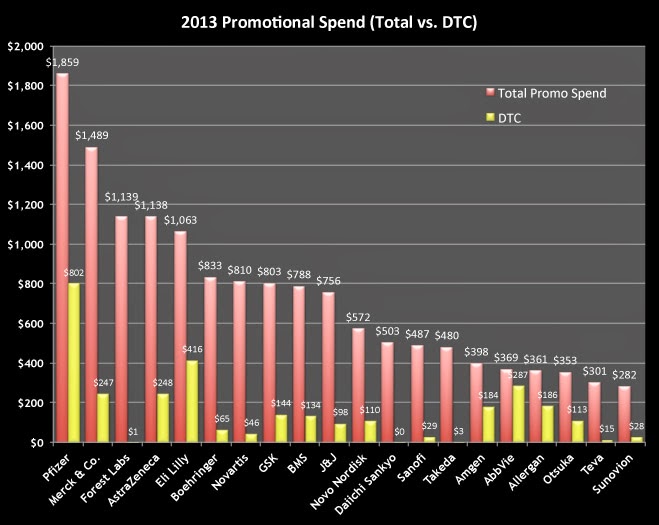
According to CSD, these top 20 companies spent a total of $14,784 Bn on traditional professional detailing, eDetailing, Direct-to-Consumer (DTC) advertising, professional meetings, and journal advertising. This does NOT include the cost of supplying drug samples. Here’s a chart showing how much each company spent totally versus on DTC:
 |
| Click on image for a larger view. |
Obviously, some companies spend a great deal on DTC (e.g. Pfizer), whereas others spend $0 or close to $0 on DTC. I’m sure that varies year to year and depends a lot upon the type of products being promoted and the life cycle stage they are in.
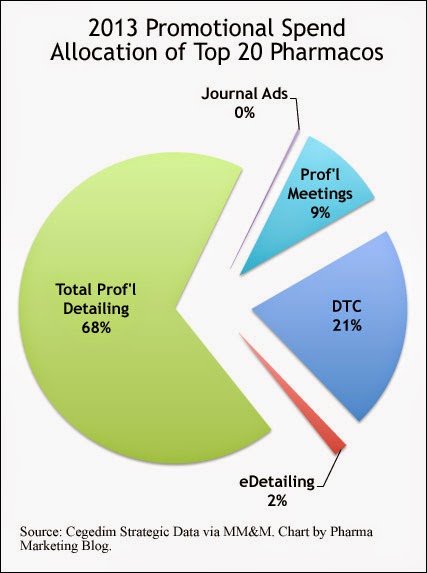
But what is the overall allocation of the promotional spend of these 20 companies? What portion of the spending pie is devoted to professional detailing, eDetailing, DTC, professional meetings, and journal advertising?
Here’s the pie and all the slices representing spending in each category:
 |
| Click on image for a larger view. |


![6 Digital Tools at the Center of Healthcare Digitalization [INFOGRAPHIC]](http://ec2-54-175-84-28.compute-1.amazonaws.com/pharma-mkting.com/wp-content/uploads/2021/04/6DigitalTools_600px-100x70.jpg)


