Every year I get a call from a market analyst asking me what the trend is for digital marketing spending in the pharmaceutical industry. He wants to know if the profits of health websites, which depend on drug display ads, will increase or decrease next year.
Who am I to judge?
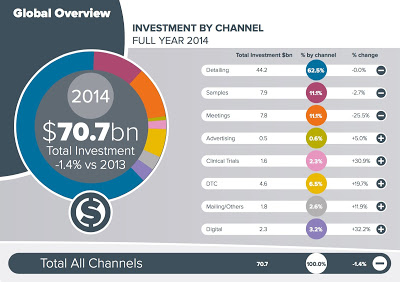
I only report the data I glean from various sources. For example, recent data from IMS Health Global Pharmaceuticals Marketing Channel Reference indicates that worldwide pharmaceutical industry investment (i.e., spending) in sales force and marketing channels was nearly $71 billion in 2014 – a drop in 1.4% from 2013. BUT… the digital channel investment increased 32%!
 |
| Source: IMS Health. Click on image for an enlarged, readable view. |
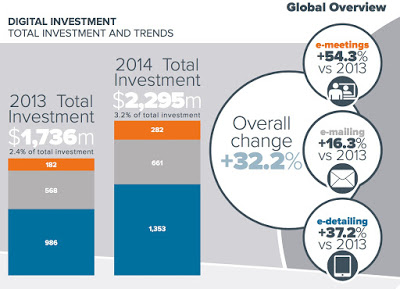
However, spending on digital channels accounts for only $2.3bn or 3.2% of the total $71 billion promotional spend worldwide.
Let’s dive a bit deeper into the data and compare it to other estimates over the years.
First, the digital data does NOT include consumer marketing channels such as web banner ads, search engine advertising, etc. IMS Health is specifically looking at e-meetings, e-mailing, and e-detailing channels focused on healthcare professionals (HCPs).
 |
| Source: IMS Health. Click on image for an enlarged, readable view. |
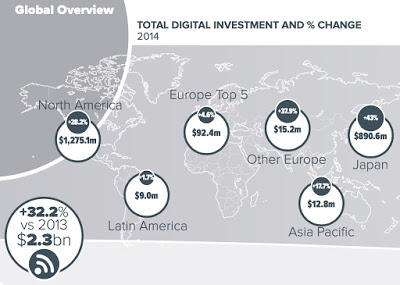
The increase in spending on digital channels (e-meetings, e-mailing, and e-deatiling) varies by region as shown in the following chart from IMS Health:
 |
| Source: IMS Health. Click on image for an enlarged, readable view. |
Growth in pharma HCP digital marketing in EU and Latin America lags that in the U.S. This, and the fact that EU digital spending is only 7% of US spending, surprises me.
Over the years I have tried to determine what portion of pharma’s total marketing budget is devoted to digital and if that portion is increasing. Various sources look at various channels and it’s not easy to compare one source with another. Even data from the same source may not compare apples to apples.
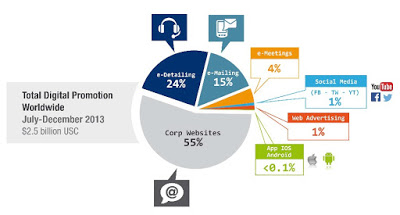
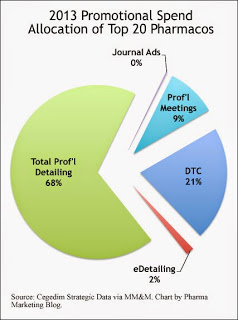
In June 2014 (here), for example, I reported that Cegedim Strategic Data (now IMS Health) estimated that the global pharma industry spent nearly $2.5 billion on all digital channels in the last 6 months of 2013 (or perhaps $5bn annually). The channels included pharma company websites, social media, web banner advertising in professional online journals and mobile apps. That worked out to be approximately 6% of the total audited marketing expenditure, which includes “traditional, personal promotional channels;” i.e., sales reps (see figure below).
 |
| Source Cegedim Strategic Data (here). Click on image for an enlarged view.
|
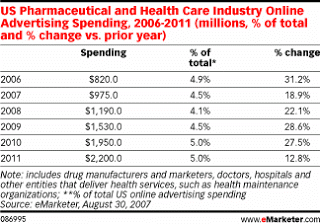
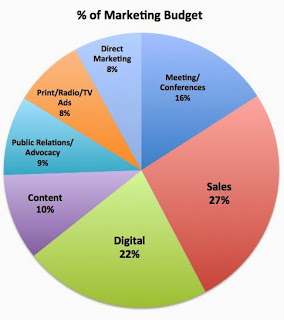
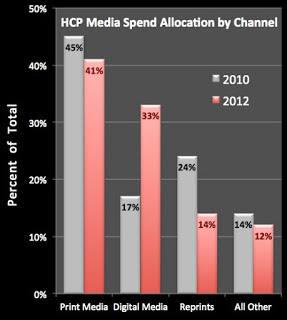
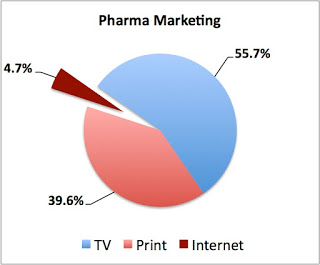
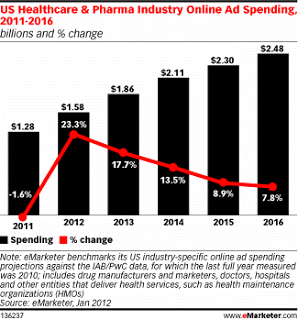
Here are some more charts I have prepared over the years that estimates what pharma spends on various marketing channels.
Note: None of these data include search engine marketing, which may account for 40% of pharma’s total digital promotional spend.







![6 Digital Tools at the Center of Healthcare Digitalization [INFOGRAPHIC]](http://ec2-54-175-84-28.compute-1.amazonaws.com/pharma-mkting.com/wp-content/uploads/2021/04/6DigitalTools_600px-100x70.jpg)


