I just started reading the book “Proofiness: The Dark Arts of Mathematical Deception” by Charles Seife. The book promises to “conduct a thorough investigation into why so many of us find it so easy to believe things that are patently ridiculous. Why, for example, does anyone take seriously the idea that some vaccines can cause autism…”
I only read the first few pages of the introduction last night, but immediately realized that what I learn from it will help me interpret the BS I often hear from pharmaceutical marketers and spokespeople.
The author defines “proofiness” as “the art of using bogus mathematical arguments to prove something that you know in your heart is true — even when it is not.” One tool used by masters of this art is fabricated statistics, which Seife calls Potemkin numbers in analogy to Potemkin villages (fake settlements purportedly erected at the direction of Russian minister Grigory Potemkin to fool Empress Catherine II during her visit to Crimea in 1787; see here).
I didn’t have to go out hunting for examples of Potemkin numbers in pharmaland — it came right to me via a tweet from @PhRMApress: “VIDEO: What Gets PhRMA’s Chairman Up Every Morning? http://t.co/MftWTiSA via @PhRMA @SanofiUS”
The first words spoken by Chris Viehbacher, PhRMA’s chairman and the CEO of Sanofi, included an impressive Potemkin number:
“One of the things that makes me most proud to be part of this industry is seeing that life expectancy has gone from 67 to 81 in a generation. It really shows the positive impact we’ve had on people and families across America.”
A life expectancy of 81 years?! In my heart, I wish it were true, but my brain tells me it is not.
I immediately stopped the video and used Google to peak behind the facade of these numbers. After all, an increase in life expectancy of 14 years in a single generation is so positive sounding that I want to believe it, but so huge that I suspected it wasn’t true.
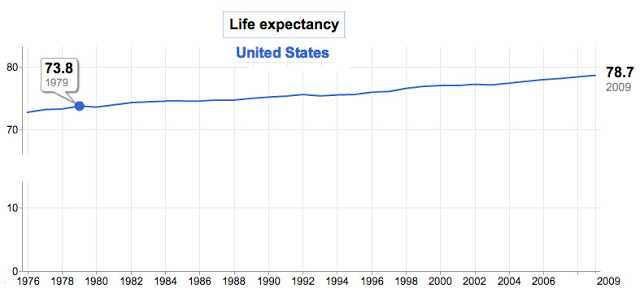
Here’s a US life expectancy chart (edited to fit better) I found via Google (World Bank data; here):
According to these data, the US life expectancy (LE) increased only about 5 years in the last generation (1979 to 2009). I don’t think US LE increased an additional 3 years since 2009 (the latest year for which real data is available). Viehbacher used Potemkin numbers to impress us with a 14-year difference, whereas the real data only supports a 5-year difference.
 Where did Viehbacher come up with his LE numbers? Perhaps he got the 81 years figure from this CNN article, which cited it as the highest life expectancy — enjoyed by residents of Fairfax County, Virginia.
That same article, however, mentioned that Holmes County, Mississippi, had the lowest LE number — 66 years. A woman in Holmes County can expect to live 73.5 years, “the average life span that women in the healthiest nations had in 1957 and have since far surpassed.” In other words, there are people in the U.S. who have LE’s that lag behind those of the world’s healthiest nations, “in some cases by 50 years or more.” Those numbers should keep Mr. Viehbacher awake ALL night!
The other problem relating to the LE issue raised by Viehbacher is his implication that the pharmaceutical industry is solely responsible for the increase in US LE (except in Mississippi, that is), which is an exaggeration. Other factors include declines in cigarette smoking. increase access to health care for vulnerable populations (eg, children), etc.
The rest of the interview has Viehbacher citing other numbers that support Medicare Part D — such as each patient receiving a $1200 benefit as a result of the program, which BTW the drug industry does not want to improve by subsidizing the closing of the infamous “doughnut” hole. The study (see here) was paid for by PhRMA, a fact that Viehbacher failed to mention. Whether or not these Medicare Part D numbers are “Potemkin numbers” or other forms of suspicious “proofiness” is something I don’t have the resources to get into now. Maybe after I finish Seife’s book I will have more anti-deception tools at my disposal.
UPDATE
Christian Clymer, Deputy Vice President, Public Affairs, PhRMA, sent me the following followup to this post via email on 28-SEP-2011:
It’s good to know you’re keeping up with The Catalyst. I just wanted to clarify some of the statistics you’ve pointed out, regarding life expectancy and the savings generated by Medicare.
The 81 years life expectancy cited by Mr. Viehbacher is consistent with CDC/U.S. Census Bureau statistics for 2010 that show average life expectancy of 81 years for women (81.4 years, to be exact). (source: http://www.data360.org/dsg.aspx?Data_Set_Group_Id=195) In 1950 the average life expectancy in the U.S. according to CDC was 68 years. That’s a dramatic rise in just two generations. The CDC numbers are also reflected in this chart… http://www.phrma.org/us-life-expectancy-1950-2007.
While all reputable data sources (e.g., WHO, CDC and others) may vary somewhat on the numbers, they all demonstrate the same fact: there has been a marked increase in average life expectancy in the U.S. and across the globe. Our industry wouldn’t presume to take credit for these statistics, but we are proud of the role that we continue to play in helping people live longer, healthier lives, as we’ve noted on PhRMA.org in the past. (New Medicines Transforming Patient Care http://www.phrma.org/new-medicines-transforming-patient-care)
Regarding the Medicare savings, Mr. Viehbacher was referring to a recent study in JAMA, conducted by Harvard researchers with no sponsorship from PhRMA or individual companies. Indeed, that study found that Medicare saved $1,200 annually for each beneficiary who had previously lacked comprehensive drug coverage prior to Part D. Those savings came from a reduction in non-drug costs such as hospitalizations and nursing home admissions. (http://www.phrma.org/catalyst/jama-study-reiterates-success-medicare-part-d and http://theincidentaleconomist.com/wordpress/part-d-cost-offsets/)
Just thought you’d want to know.
I hope Chris doesn’t mind me adding this response, which I sent to him in reply:
I would point out that Viehbacher mentioned ONE generation (“a generation”), not two, which may have been just an honest mistake, I’m sure. Of course, white females live about 5 years longer than us guys! So, you’re not really comparing apples to apples (ie, females to females) when you cite 81 for females in 2010 and 68 for the general population (I assume) in 1950. As for the JAMA Medicare study, I’ll have to take a look at it.


![6 Digital Tools at the Center of Healthcare Digitalization [INFOGRAPHIC]](http://ec2-54-175-84-28.compute-1.amazonaws.com/pharma-mkting.com/wp-content/uploads/2021/04/6DigitalTools_600px-100x70.jpg)


