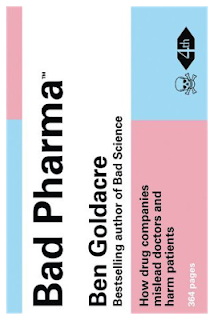
I finally finished reading the 400 plus page book Bad Pharma™ by BenGoldacre, a British physician, whose previous book, Bad Science, was a best seller in the “non-fiction” realm.
As the name suggests, Bad Pharma is a no-holds-barred critique of practically every aspect of the pharmaceutical industry from drug development to marketing. Chapter titles include reiterations of the “bad” theme such as “Bad Trials” and “Bad Regulators.” The chapter on marketing, which comprises about 25% of the book, is merely titled “Marketing.” Goldacre summarizes the raison-d’etre of pharma marketing as existing for “no other reason than to pervert evidence-based decision making in medicine” and proceeds to “take a look at this mysterious world.”
Of course, pharma marketing is not “mysterious” to me. I am familiar with most of Goldacre’s criticisms, having written about the same subjects for many years. I was surprised, therefore, when none of my posts to this blog was referenced by Goldacre!
For example, when Goldacre states unequivocally that “tens of billions of pounds are spent each year, $60 billion in the US alone, on medicines marketing,” he might have referred to my post that disputed this number (“Promotion vs. R&Deja vu all over again!“; also, see my analysis below).
I’d like to focus on this issue again here because it illustrates how Goldacre “cherry picks” data to buttress his argument despite his claim otherwise (“this book is based on systematic reviews, which summarise all of the evidence ever collected on a given question“) and his claim that the pharma industry does the same; e.g., fails to report negative trial data, which is the focus of the first chapter of his book, “Missing Data”, and which is “key to the whole story.”
How much money the drug industry spends on marketing vs. research and development is a contentious issue, as Goldacre points out. “Marketing spend is a contested area, as the industry is keen to play it down,” says Goldacre in the Notes section of the book where he could have referenced my post above, but did not. Nevertheless, he summarizes the issue this way:
“A quarter of the pharmaceutical industry’s revenue is spent on marketing, twice as much as it spends on research and development, and this all comes from your money, for your drugs. We pay 25% more than we need to, an enormous mark-ip in price, so that tens of billions of pounds con be spent every year producing material that actively confuses doctors and undermines evidence-based medicine.”
“This is a very odd state of affairs,” says Goldacre.
It’s also “odd” that Goldacre’s math does not add up. The value of the global pharmaceutical market was estimated to be US$880 billion in 2011 according to IMS Health (see “Pharmerging Markets to Continue Strong Growth“). One quarter of that would be over US$200 billion. All of this, of course, is not spent in US marketing, which Goldacre pegged as US$60 billion. However, I cannot imagine that the difference (US$140 billion) is spent in other countries. US marketing spend must be about 75% of the total in line with the overall size of the US market compared to the rest of the world. Even if it’s only 50% that would mean US$100 billion spent on pharma marketing in the US, which is quite a bit more than the US$60 billion that Goldacre cited a few pages earlier in his book.
OK, that’s a math error. But Goldacre also cites conflicting numbers for pharma marketing spending in the US. While he cites US$60 billion on page 246, on page 317 he says “we know that $30-40 billion is spent by the industry on drug marketing in the America” (aka “US”).
I don’t want to nitpick, but which is it: $60, $100, or $30 billion? Obviously, whatever the number, it’s big. But is it twice as big as the R&D spend? That’s the main thing Goldacre and other critics of the drug industry want people to believe in order to blame marketing for the high cost of drugs.
Let me revisit my critique of the $60 billion number that Goldacre cited and thus debunk the notion that pharma spends twice as much on marketing as it does on R&D.
The study that Goldacre cited for the $60 billion estimate was done by two Canadian authors: “The Cost of Pushing Pills: A New Estimate of Pharmaceutical Promotion Expenditures in the United States,” which was published in PLoS Medicine.
Their conclusion: The pharmaceutical industry spends almost twice as much on the marketing and promotion of drugs than on research and development (see the story here).
“For the last 50 years, say the authors, there has been an ongoing debate as to which image [see left] of the drug industry is most accurate. The industry promotes a vision of itself, say the authors, as ‘research-driven, innovative, and life-saving,’ but the industry’s critics contend that the drug industry is based on ‘market-driven profiteering.'”
To prove this, the authors use data from 2 different sources: IMS and CAM as shown in this table:

Is anyone troubled by the methodology of the authors?
I mean, what could be easier than cherry picking which data to use and to make sure to always use the highest estimate to prove your point, which you obviously believed was true before you even did the “analysis?”
In essence, the authors place more value on the CAM data then on the IMS data. I’m not sure why, since both companies provide services for a fee to the pharmaceutical industry. The main difference between the two company’s methodology is that IMS surveys the industry whereas CAM surveys doctors.
If you ask me, one methodology (IMS’s) overestimates R&D costs and underestimates promotional costs, while the other (CAM’s) is prone to exactly the opposite.
The biggest differences between the datasets involve cost of samples, cost of detailing, and “unmonitored promotion.”
Cost of Samples
There is a large difference between the IMS (US$15.9 billion) and CAM (US$6.3 billion) estimates for cost of samples. Essentially, IMS bases its estimate on the retail value of samples, whereas CAM bases it on the Average Wholesale Price.
Which number would you use?
The PLoS authors use the IMS retail cost estimate because that is how the drug industry itself estimates the value of free samples it gives away! This is just another case where the industry shoots itself in the foot. It’s hard to argue with the PLoS authors’ statement that “it is inconsistent for donations to be reported in terms of retail value and samples in terms of wholesale value.”
Cost of Detailing
The authors point out that “There is a significant discrepancy between the two sets of data in the cost of detailing: US$7.3 billion for IMS and US$20.4 billion for CAM.”
IMS only considers the “cost to field the rep” and doesn’t include in its estimate–as CAM does–indirect costs like costs for the area and regional managers, the cost of the training, and the cost of detail aids such as brochures and advertising material.
The authors claim that “relying on physician-generated data to estimate the amount spent on detailing [which is CAM’s data collection method] is likely to give a more accurate figure than using figures generated by surveying firms [which is IMS’s method]. Companies may not report some types of detailing, for example, the use of sales representatives for illegal off-label promotion, whereas doctors are not likely to distinguish between on- and off-label promotion and would report all encounters with sales representatives.”
I dunno. If it were up to me, I would use a number somewhere in between the IMS and CAM estimate–say $10 billion.
“unmonitored promotion”
I am especially troubled by the $14.4 billion estimate for “unmonitored promotion.” All that the PLoS authors have to say about this is:
“We believe that it is appropriate to correct for unmonitored promotion and that the figure we used is a reliable estimate. The 30% correction factor is based on a direct comparison that CAM is able to make between the data it collects through its surveys and the amount reported by companies.”
May I say that this hardly rises to the level of objective analysis of available data? My analysis would completely discount this number as something that cannot be known and therefore should not be used. Besides, the same could be said for R&D spending and the two estimates would cancel one another.
My “NEW NEW” Estimate
Instead of the estimate of $57.5 billion that the PLoS authors use for promotional spending in the US, my NEW NEW estimate is $32.7 billion, which is pretty close to the $29.6 billion the PLoS authors use for the R&D estimate. This would lead me to conclude that–within the sampling margin of error, the US pharmaceutical industry spends about as much on R&D as it does on promotion. There! Everyone’s happy!
Of course, I don’t expect Goldacre to be happy with my NEW NEW estimate. He is a doctor and therefore would tend to favor physicians’ anecdotal estimates vs industry’s estimates of how much is spent on pharma marketing. That is, he favors a distinctly NON evidence-based approach when it suits his goal.
| What is your estimate of the ratio of global pharma spending on marketing vs R&D? | |
| Marketing Spend = R&D Spend (about same) | |
| Marketing Spend = 2 X R&D Spend (twice as much) | |
| Marketing Spend = 0.5 X R&D Spend (about half) | |
| I prefer to avoid the issue altogether | |


![6 Digital Tools at the Center of Healthcare Digitalization [INFOGRAPHIC]](http://ec2-54-175-84-28.compute-1.amazonaws.com/pharma-mkting.com/wp-content/uploads/2021/04/6DigitalTools_600px-100x70.jpg)


