According to Kantar Media, pharma industry spending on direct-to-consumer (DTC) advertising totaled $5.4 billion in 2015 compared to $4.3 billion in 2014 – a 19% increase. This ties the high mark of $5.4 billion spent in 2006 (see chart below).
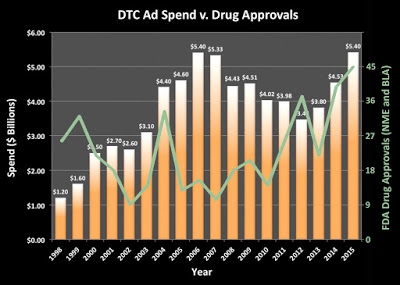 |
| Spending Data from Nielsen & Kantar Media (last 2 years), Drug Approval Data from FDA. |
It hardly takes a genius to realize that when FDA approves more drugs for marketing, more marketing happens. I plotted the number of new drugs (New Molecular Entities plus Biologics) approved by the FDA in an overlay to see if there was a direct correlation. Generally, I’d say there is a correlation if you allow for a delay in approval until advertising begins. Other factors, however, such as patent expiration, competition, etc., also play a role in determining DTC advertising budgets.
UPDATE 6-APR-2016:
There was one other piece of data that surprised me.
Since 2011, the portion of DTC spending on TV has increased from 55% to 69% as shown in the chart below.
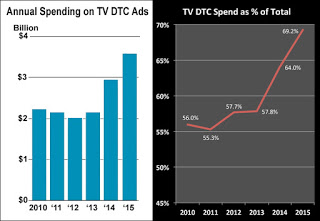 |
| Click on image for an enlarged view. |
This surprises me because I’m always hearing how Americans are watching less and less TV (read “Pharma DTC Advertising Spend vs. Time Consumers Spend in Various Media” and see chart below).
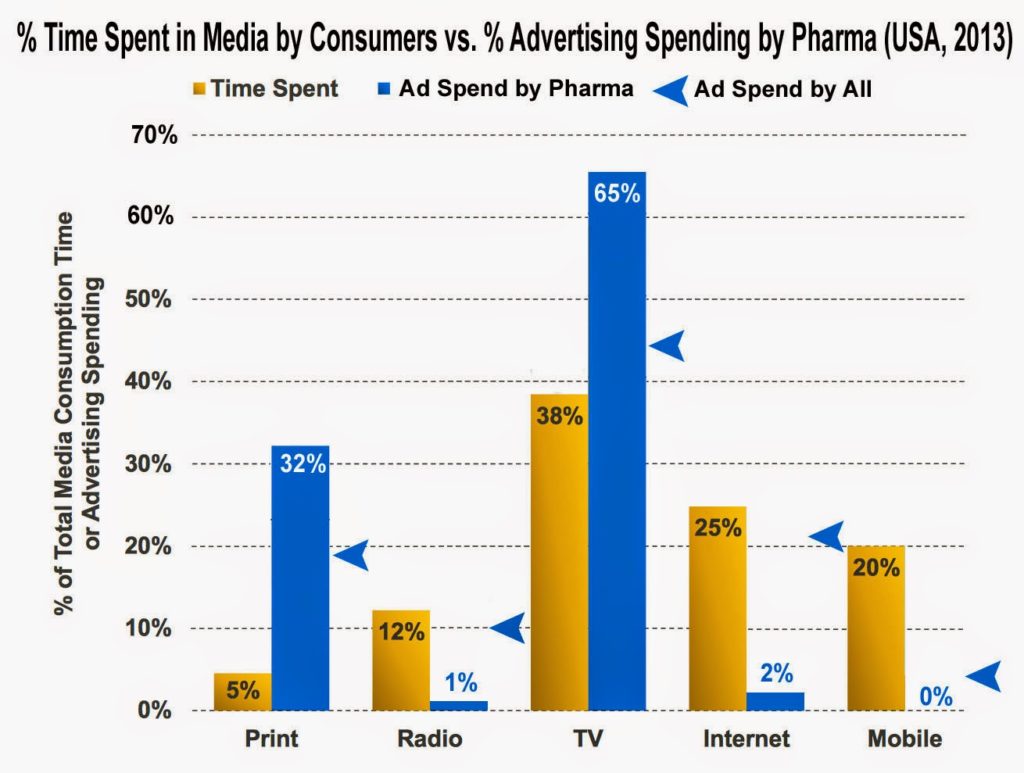 |
| Pharma’s media spend seems out of sync with the time consumers spend on various media. Click on chart for enlarged view. |
But older Americans probably watch TV as much as ever and many of the top 10 advertised drugs treat conditions, such as erectile dysfunction, that affect mostly oldsters.
Pfizer accounts for about 30% of the total DTC ad spend and its current and future focus seems to be on “Getting Old” (read “Pfizer’s Social Media Initiatives are Getting Old”).
So, as Americans are getting older and as pharma focuses more and more on drugs that treat diseases of old age such as Alzheimer’s, it’s to be expected that more and more of the industry’s advertising budget is devoted to TV.




![6 Digital Tools at the Center of Healthcare Digitalization [INFOGRAPHIC]](http://ec2-54-175-84-28.compute-1.amazonaws.com/pharma-mkting.com/wp-content/uploads/2021/04/6DigitalTools_600px-100x70.jpg)


