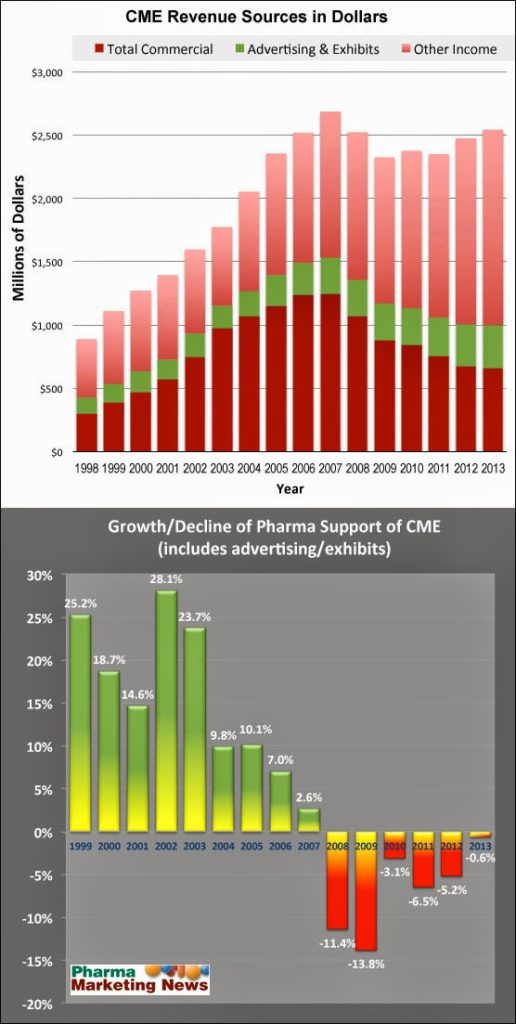
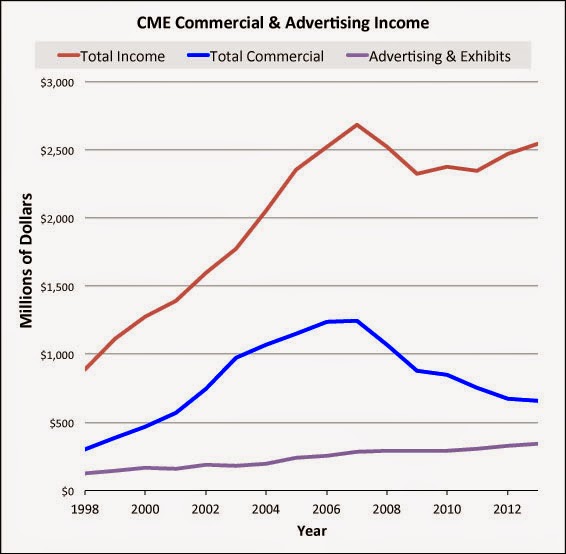
The Accreditation Council for Continuing Medical Education (ACCME) 2013 Annual Report is out. Here’s the data regarding total CME income and breakdown according to source of income. Note: the data analyzed in this post include income received by BOTH ACCME-Accredited and ACCME-recognized State-Accredited CME providers.
 |
| Click on chart for enlarged view. |
Let’s look more closely at the numbers for pharma support.
The pharmaceutical industry supports CME through grants to accredited providers such as medical societies, medical schools and for-profit Medical Education Communications Companies (MECC’s). It also helps finance CME through advertising and exhibiting at CME events. I include the latter in my analysis of total pharma support, which decreased slightly (0.6%) in 2013 compared to 2012 (dropping from $1,006,327,936 in 2012 to $999,791,328 in 2013). Advertising and exhibit income increased from #331.6 million in 2012 to $339.8 million in 2013.
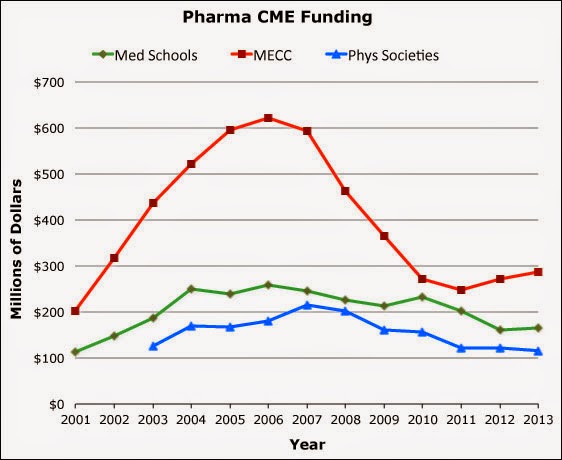
Pharma continues to provide more funding to for-profit MECCs than to non-profit physician societies and medical schools as shown in the following chart. This may be due to the fact that some schools and societies implemented policies whereby CME funding is grouped into on big fund and pharma companies have less say in which programs will receive the money donated.


![6 Digital Tools at the Center of Healthcare Digitalization [INFOGRAPHIC]](http://ec2-54-175-84-28.compute-1.amazonaws.com/pharma-mkting.com/wp-content/uploads/2021/04/6DigitalTools_600px-100x70.jpg)


